Introduction
In a class setting, teachers typically observe, grade and instruct students in order to collect data. However, surveys are great to have a feel of how students actually think and perceive about themselves and the class.
Last semester, I instructed MIDP’s public speaking students to fill up a simple survey and thereafter, made observations on the data collected based on the objectives I had set for the exercise. I was surprised by what I found and am excited to share the results below. But first, some context!
Context
Data
The survey was answered by 37 participants (2 of which weren’t public speaking students – some friendly test subjects, i.e. my sisters, haha) with the following data profile:
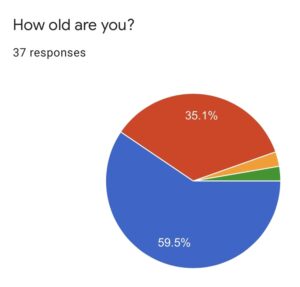
Age: 59.9% of respondents were between 7-12 years old while 35.1% were between 13-17 years old.

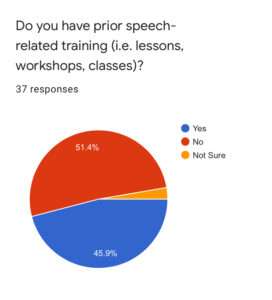
Training & Experience: A majority of participants do not have prior speech-related training (51.4%) and have not participated in either public speaking (64.9%) or debate (81.1%) competitions.
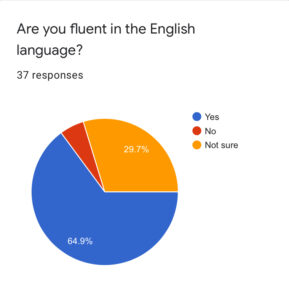
Language: A majority of students believe that they are fluent in English (64.9%) and read non-academic books regularly (67.6%). Inversely, a majority of students agree that they do not read the news regularly (54.1%).
Observations
The survey participants are relatively young and most do not have prior speech-related experience. This means that my lessons should be more beginner-friendly rather than competition-heavy. Most of my students are also fluent in English and reads regularly. This is comforting as I am always wary of my students not understanding the terms I use in class.
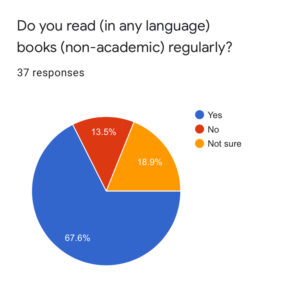
However, it should be noted that save for the debate-related answer, most majorities were very slight (nothing above 68%). A closer look at the data shows that a substantial number of students were actually “Not Sure” whether they are fluent in English (29.7%) or read books regularly (18.9%). This is important for me to take note of as I would have to ensure that the concepts I teach are easy to comprehend for any English proficiency level. With this context in mind, we now turn to the answers.
Objective 1: To assess students’ motivation and main aims in improving their speaking skills
Data
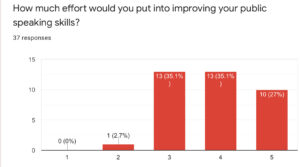
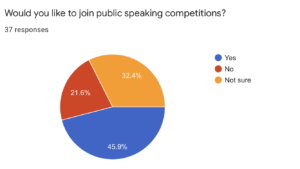
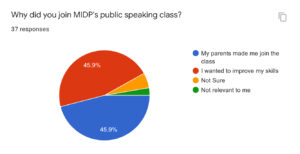
While a majority of survey participants (89.1%) wanted to improve their speaking skills (with 8.1% saying that they weren’t sure), only 75.7% were willing to put in actual effort and on a scale of 1 to 5, only 27% were willing to put in the maximum effort. Despite this, 45.9% are still willing to join public speaking competitions. It is to be noted that there is an equal number of students (45.9%) who either joined the class because they wanted to improve or were “made to join” by their parents.
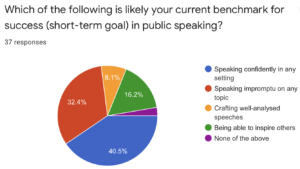
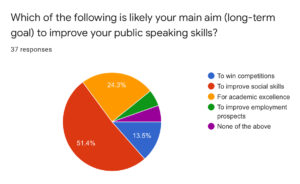
When asked about their main aims/long term goals for public speaking, most said that they would like to improve their social skills (51.4%) with academic excellence (24.3%) in second place and winning public competitions in third place (13.5%). The students’ short term goals/current benchmark for success were quite varied. 40.5% wanted to be able to speak confidently in any setting, 32.4% wanted to be able to speak impromptu on any topic and 16.2% wanted to be able to inspire others. Only 8.1% of survey participants wanted to craft well-analyzed speeches.
Observations
While there is a small percentage of students willing to put in the maximum effort to improve their skills, almost half of the participants were willing to compete in the same skill. This means that competitive public speaking is likely not seen as “maximum effort“. These are good indicators of what the students are willing to do to improve. In this regard, I will do more to encourage participation in competitive public speaking hoping to spark further interest in the skill.
Looking at the raw data, 80% of students willing to put in maximum effort joined the class on their own volition. This would explain why it would either be very easy to motivate some students and very hard to motivate others. Those who joined the class wanting to win competitions regularly reads and are fluent in English need no motivation to work hard. However, those who were forced to join the class, with difficulties in the language and a big fear of speaking in public, are much harder to motivate. If they already found the skill difficult and do not want to improve, then the likelihood of participation is very low.
Therefore, I have to either find a way to make the activities fun and appealing to them in order to generate interest or tie the objectives of the class to their own personal objectives. To better incentivize students, next semester’s lessons will concentrate on making the activities more inclusive to all speech levels and aligning the class objectives to each students’ future goals.
What was very surprising to me was the motivation behind wanting to improve their speaking skills. What I understood from my interactions with the students in class was that public speaking was important to ace job interviews, academic presentations and increase future prospects. However, it seems that their priority was actually to better socialize. This is also consistent with the students’ main short term goal, which is to speak confidently in any setting.
This is mindblowing for me because my classes were always structured to encourage speech research, structured presentations and critical thinking – essential ingredients to craft a good speech – which to my horror, only 8.1% of them felt was their short term benchmark for success! This means that my classes next semester should include more activities that mimic social settings and encourage social cues.
Objective 2: To assess the students’ perceived strengths and difficulties in speaking
Data
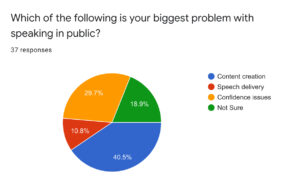
When asked about their biggest difficulty, a majority of students (40.5%) chose content creation with confidence issues as a close second (29.7%). 18.9% of students were not sure of their “biggest problem”.
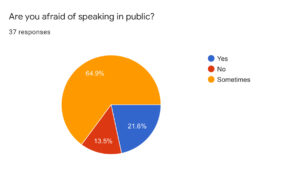
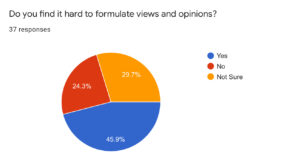
Such results were consistent with 45.9% of students claiming that they found it hard to formulate their own opinions and views – which, once again, 29.7% of students were “Not Sure” of. Only a small percentage (13.5%) said that they were not afraid to speak in public with a majority (64.9%) stating that they were only “Sometimes” afraid.
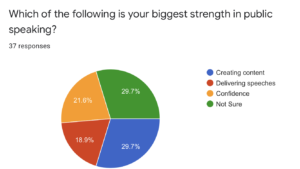
When asked about their biggest strength, 29.7% of them chose content creation with the same percentage of participants choosing “Not Sure”. About 21.6% chose confidence while the rest (18.9%) chose speech delivery.
Observations
It is somewhat surprising to see that content creation is both the biggest difficulty and strength for the survey participants. This seems counterintuitive and inconsistent with the majority (45.9%) view that formulating views were difficult. To remedy this inconsistency, I checked the raw data and noticed that the participants who thought content creation was a big difficulty either found confidence issues or speech delivery as their biggest strengths with an equal number of them being “Not Sure” of their strengths.
What was more surprising was the discovery that a substantial number (always above 7) of participants were unaware of their weaknesses and strengths, especially the latter. This is worrying because in order to improve, the first step would always be the determination of your strengths and weaknesses, and thereafter capitalize on the former and improve on the latter. It could also be the case that the participants are more critical of their weaknesses and are not confident with their strengths. This is reflected in the higher number of participants who were “Not Sure” of their “Strengths” (29.7%) rather than their “Weaknesses” (18.9%). Whatever the reasons were for such answers, it is clear that participants need to be better trained to conclusively self-assess. I will work on better pre-assessment activities and peer review exercises.
Regardless of what their perceived strengths and weaknesses are, it is clear that a majority found formulating views and speaking in public difficult. Hence, content creation would be at the forefront of my lessons next semester.
Objective 3: To assess the students’ preferred methods of being taught in class
Data
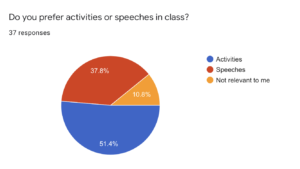
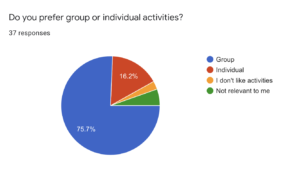
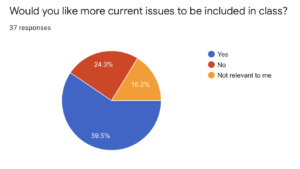
51.4% of students prefer activities over speeches with 75.7% preferring group activities over individual activities. A majority of participants (59.5%) want more current news and issues discussed in class with a smaller majority (51.4%) preferring less take-home assignments.
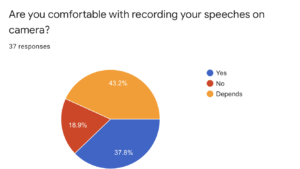
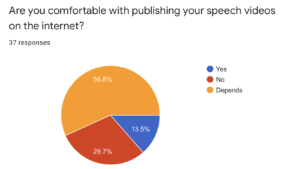
37.8% of participants are comfortable with recording their speeches, and an even smaller percentage of 13.5% are comfortable with publishing them online.
Observations
It is always important to me that students are taught in a way that is most conducive and meaningful to them, measured by the efficacy in which they are able to absorb knowledge and how well the class is able to reach their personal goals. The preference of activities over speeches and group activities over individual activities are consistent with the social goals that the participants have – of being better able to socialise. However, it could also be the case that students feel more comfortable in numbers as giving a speech alone is more daunting than completing a task in a group. Nevertheless, this is still surprising to me as during class, most students begrudge being put into groups and are typically found working alone, despite being told to present as a team.
Considering the average age of the students, it is surprising to see a majority of participants (59.5%) wanting more current news and issues discussed in class. While I am happy that students would like these issues discussed, it is also important to be sensitive of their ages and how best such information can be absorbed and processed. I also find this comforting as despite a majority of them admitting to not read news at home, it is not from the lack of interest. Though I am not surprised that a majority (51.4%) of participants do not want to have more take-home assignments, I am surprised at the amount of students (37.8%, equivalent to 14 students) who actually want more homework. The latter likely to be those who had joined the class willingly and intend to put in maximum effort to improve.
One of the best ways to improve would be to record, review and reflect on your own speeches. This can be done through video recordings where students are able to see where they did well and where they did not-so well. It is also a good way to mark their improvements, by comparing their old videos with new ones. I also think it’s important to celebrate good speeches and the idea of not being afraid to publish your thoughts to the public. Even though only a small percentage (37.8%) of students are comfortable with recording their speeches, there is still hope as the majority did not answer “No” but rather, “Depends” when it came to recording themselves (43.2%) and then publishing their videos (56.8%).